
Organizations running production AI workloads face mounting pressure around data privacy regulations, API cost volatility, and network latency constraints that cloud-hosted language models cannot adequately address.
Local LLM deployment infrastructure enables enterprises to achieve complete data sovereignty, sub-100ms inference latency, and predictable capital expenditure while maintaining full control over model versioning and security policies.
The shift toward on-premise LLM deployment reflects strategic requirements rather than technical preferences.
This is particularly true for financial services, healthcare, and government sectors where data residency mandates prohibit external API calls.
Private AI deployment architectures must balance compute density against operational complexity while addressing thermal management, networking throughput, and storage I/O patterns that differ substantially from traditional application workloads.
Engineering teams evaluating local AI inference solutions confront trade-offs between GPU memory allocation strategies, model serving frameworks like vLLM versus Ollama, and orchestration platforms capable of managing stateful AI workloads at scale.
These decisions directly impact inference throughput measured in tokens per second, concurrent request handling, and mean time to first token for streaming responses.
Production self-hosted LLM systems require comprehensive observability spanning GPU utilization metrics, prompt token distributions, cache hit rates, and request queue depths to maintain service level objectives under variable load conditions.
Enterprises deploying local LLM infrastructure must architect for horizontal scalability, implement zero-trust network policies, and establish continuous model evaluation pipelines that validate output quality against regression benchmarks before promoting inference endpoints to production traffic.
Key Takeaways
- Local LLM infrastructure provides data sovereignty, predictable costs, and sub-100ms latency for compliance-driven enterprises
- Production deployments require careful hardware selection, model serving framework evaluation, and orchestration platform integration
- Comprehensive observability across GPU metrics, token throughput, and cache performance ensures reliable service level objectives
Core Components of a Self-Hosted AI Stack
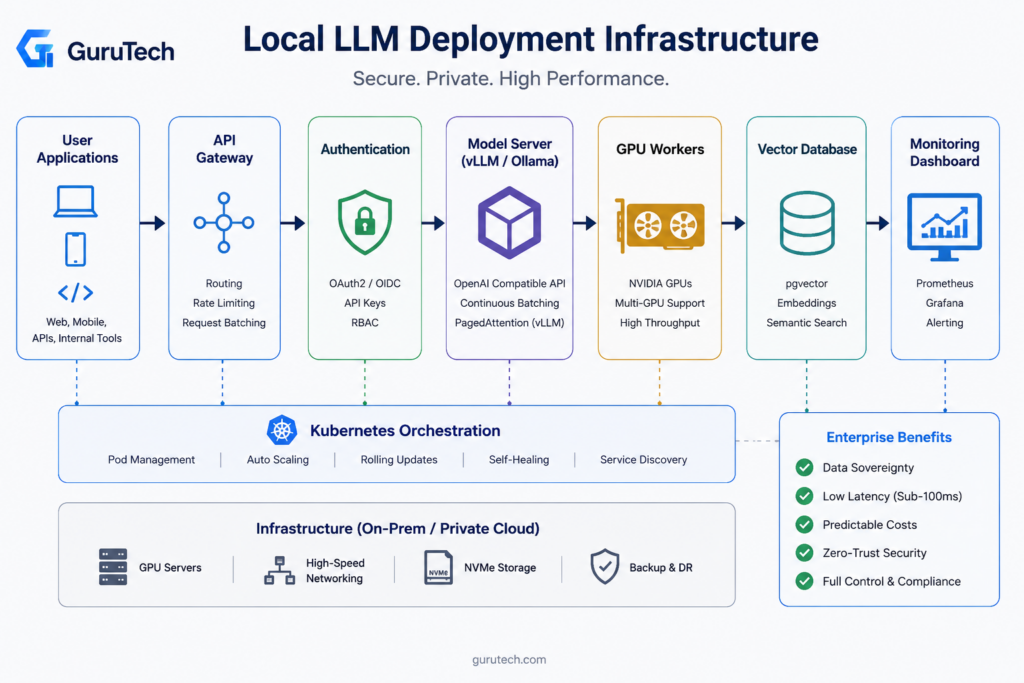
A production-ready self-hosted LLM enterprise deployment requires eight critical infrastructure layers that work together to serve models reliably at scale.
The architecture spans from API gateways handling external requests through GPU workers executing inference, with supporting components for authentication, vector storage, observability, and orchestration.
API Gateway
The API gateway serves as the entry point for all inference requests in an enterprise AI infrastructure deployment.
It handles request routing, rate limiting, and protocol translation between external clients and internal model servers.
Modern gateways like Kong or Traefik provide built-in support for OpenAI-compatible endpoints, allowing seamless migration from hosted APIs to self-hosted infrastructure.
Request batching at the gateway layer significantly improves GPU utilization by grouping concurrent requests before forwarding them to model servers.
Dynamic batching reduces per-request latency by up to 40% compared to sequential processing, particularly for models with batch-friendly architectures like BERT or GPT variants.
Circuit breaker patterns prevent cascade failures when downstream GPU workers become unavailable.
The gateway should implement health checks with configurable timeout thresholds, typically 30-60 seconds for inference endpoints.
Request queueing with priority levels ensures critical workloads receive resources first during peak demand periods.
Model Server
Model servers handle the actual inference execution and expose standardized APIs for client applications.
vLLM and Ray Serve dominate production deployments due to their advanced memory management and continuous batching capabilities.
vLLM achieves 2-4x higher throughput than baseline implementations through PagedAttention, which manages KV cache memory more efficiently.
The choice between KServe and Ollama depends on orchestration complexity.
KServe integrates natively with Kubernetes and supports multi-model serving with canary deployments and A/B testing.
Ollama provides simpler operations for teams running fewer models with less complex routing requirements.
| Framework | Best For | Throughput | Memory Efficiency |
|---|---|---|---|
| vLLM | High concurrency | 2-4x baseline | Excellent |
| Ray Serve | Multi-model pipelines | 1.5-2x baseline | Good |
| Ollama | Simple deployments | 1-1.5x baseline | Moderate |
Model servers must implement request cancellation to free GPU memory when clients disconnect.
This prevents resource leaks during long-running generation tasks.
GPU Workers
GPU inference server nodes execute the actual model computations and represent the most expensive infrastructure component.
NVIDIA A100 and H100 GPUs remain the standard for production LLM serving, with H100s providing 3x faster inference for large models compared to A100s due to higher memory bandwidth.
Worker node configuration directly impacts cost efficiency.
A single A100-80GB GPU can serve Llama-2-70B at 4-bit quantization with reasonable latency for batch sizes up to 32.
Smaller models like Mistral-7B run efficiently on RTX 4090 or A10G GPUs, which cost significantly less per hour in cloud environments.
GPU memory fragmentation becomes problematic in long-running deployments.
Workers should restart automatically after processing a configurable number of requests, typically 10,000-50,000 depending on model size and quantization level.
This prevents gradual performance degradation from memory leaks in model inference libraries.
Multi-GPU setups require careful attention to tensor parallelism and pipeline parallelism strategies.
Models exceeding single-GPU memory capacity split across multiple devices, with communication overhead adding 15-25% latency depending on interconnect speed.
NVLink or InfiniBand connections minimize this overhead compared to PCIe-based multi-GPU configurations.
Authentication
Enterprise deployments require robust authentication to control API access and track usage per team or application.
OAuth2 with JWT tokens provides the standard approach, with tokens carrying user identity and permission scopes.
The authentication layer sits between the API gateway and model servers, validating tokens before forwarding requests.
API key rotation policies prevent unauthorized access from leaked credentials.
Keys should expire after 30-90 days with automated rotation workflows integrated into CI/CD pipelines.
Rate limiting per API key prevents individual applications from consuming excessive GPU resources.
Multi-tenancy isolation requires namespace-level authentication when multiple teams share the same infrastructure.
Kubernetes RBAC policies combined with network policies ensure teams cannot access each other’s model endpoints or monitoring data.
Vector Database
Vector databases store embeddings for retrieval-augmented generation workflows and semantic search capabilities.
Qdrant and Weaviate lead in GraphRAG architecture enterprise deployments due to their filtering capabilities and horizontal scaling properties.
Production systems typically store 10M-1B vectors depending on knowledge base size.
Embedding dimensionality directly affects storage and query performance.
Models like text-embedding-3-large produce 3,072-dimensional vectors, requiring approximately 12KB per vector with metadata.
Reducing dimensionality to 1,536 through model selection or PCA halves storage costs with minimal accuracy loss for many use cases.
Index types balance query latency against memory consumption.
HNSW indexes provide sub-10ms query times but require the full index in RAM.
IVF indexes reduce memory usage by 5-10x with slightly higher latency, making them suitable for larger datasets exceeding available RAM.
Replication strategies ensure high availability for vector queries.
Three-replica deployments with read replicas distributed across availability zones achieve 99.9% uptime.
Write operations require careful coordination to maintain consistency across replicas without sacrificing insert throughput.
Monitoring
Production monitoring tracks inference latency, GPU utilization, token throughput, and error rates across the stack.
Prometheus with Grafana provides the standard observability platform, collecting metrics from model servers, GPU workers, and API gateways.
OpenTelemetry instrumentation enables distributed tracing across complex request paths.
Key metrics include P50, P95, and P99 latency distributions rather than averages, which mask tail latencies affecting user experience.
GPU memory utilization should stay between 70-90% for optimal efficiency—lower utilization wastes capacity while higher levels risk out-of-memory errors.
Token-level observability reveals which prompts consume excessive compute resources.
Tracking input token count, output token count, and time-to-first-token helps identify optimization opportunities.
Prompts generating more than 2,000 tokens often indicate poorly designed applications that could benefit from summarization or chunking.
Alert thresholds must account for natural workload variation.
GPU temperature exceeding 85°C or memory utilization above 95% warrant immediate investigation.
Model server error rates above 1% typically indicate configuration problems or insufficient resources.
Load Balancer
The load balancer distributes inference traffic across healthy model-serving replicas while protecting users from overloaded GPU workers.
Production routing should use backend queue depth, GPU cache utilization, and recent error rates rather than simple round-robin distribution.
When multiple vLLM replicas serve the same model, sticky routing can improve prefix-cache reuse for repeated system prompts and long enterprise workflows.
Health checks should validate both process availability and model responsiveness with a lightweight prompt.
This avoids routing production requests to pods that are alive but unable to generate tokens because of CUDA faults, memory exhaustion, or model corruption.
Implementation takeaway: Treat load balancing as an inference-aware control plane, not just a generic HTTP traffic splitter.
The Compute Cost Paradox: CapEx vs OpEx in On-Premises AI
Organizations deploying local LLMs face a fundamental financial restructuring.
Cloud services favor OpEx with pay-as-you-go pricing, while on-premises infrastructure demands substantial upfront capital investment in GPUs, networking, and cooling systems.
The hardware acquisition represents the primary CapEx burden.
An NVIDIA A100-80GB costs approximately $15,000 per unit, while enterprise deployments for models like Qwen3-235B require at least 4 GPUs at $60,000 initial investment.
Larger models push this significantly higher—a 16-GPU cluster for trillion-parameter models reaches $240,000 before factoring in servers, storage, or networking infrastructure.
Operational expenditures include power, cooling, maintenance, personnel, and software licensing that accumulate monthly.
Power consumption alone for high-density GPU clusters can exceed $10,000 monthly at scale.
Infrastructure teams must account for HVAC upgrades, dedicated circuits, and redundant power supplies that increase facility costs.
The paradox emerges when organizations analyze break-even periods for on-premises versus cloud deployment.
Small models achieve cost parity within months at high volume.
Medium-sized models require approximately two years of sustained usage.
Large models demand five-year horizons, making local deployment viable primarily for organizations processing 50M+ tokens monthly or those with strict data residency requirements.
Platform engineers should model TCO across 3-5 year timelines, incorporating GPU depreciation, inference optimization gains through vLLM or TensorRT-LLM, and scaling patterns.
Organizations amortizing hardware costs over longer periods gain significant advantages when inference volumes justify the infrastructure investment.
Selecting Hardware Platforms for Performance and Scalability
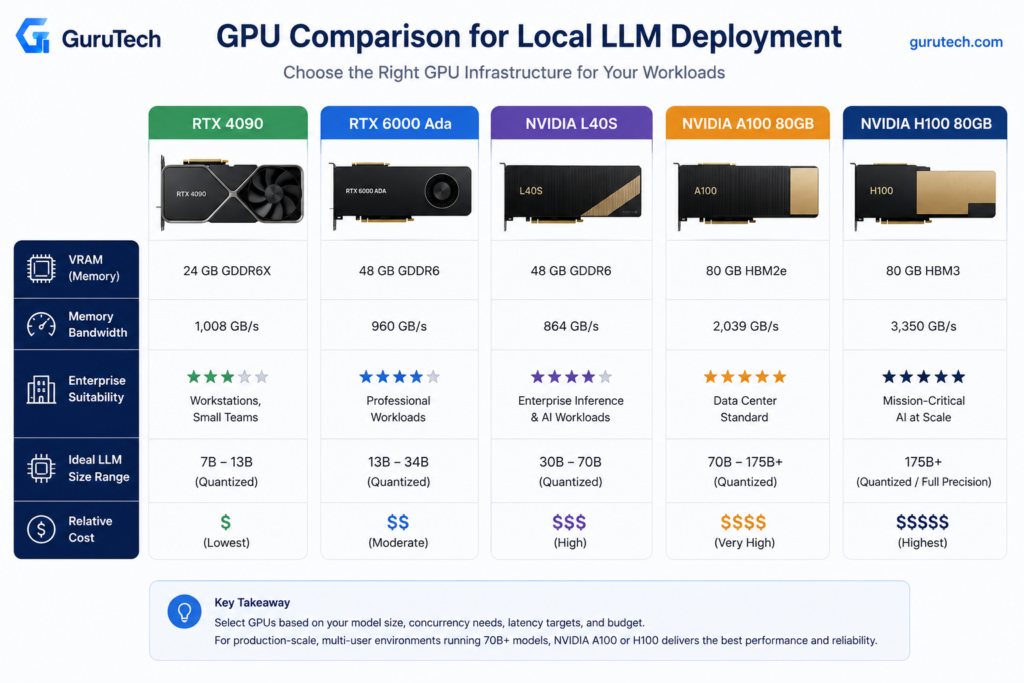
Memory bandwidth and VRAM capacity determine inference throughput more than raw compute, while PCIe lanes and NVMe storage affect model loading times and multi-tenant deployments.
Enterprise teams must balance capital expenditure against operational costs when choosing between consumer GPUs, datacenter accelerators, and CPU-only inference.
RTX 4090
The RTX 4090 delivers 1,008 GB/s memory bandwidth and 24 GB VRAM at roughly $1,600, making it the most cost-effective option for 70B parameter models with quantization. Production deployments achieve 55 tokens per second on Qwen 3.5 27B with 4-bit quantization using vLLM or Ollama backends.
The card lacks ECC memory and multi-GPU NVLink support, limiting fault tolerance in production environments. Teams running Ray Serve clusters with multiple RTX 4090 nodes must implement application-level checkpointing rather than relying on hardware error correction.
Power consumption reaches 450W under full load, requiring dedicated 20A circuits and proper cooling infrastructure. Kubernetes deployments using the NVIDIA device plugin can schedule workloads across multiple RTX 4090 nodes.
PCIe 4.0 x16 bandwidth becomes a bottleneck when serving multiple concurrent requests. The RTX 4090 works best for development clusters, A/B testing environments, and cost-sensitive production deployments where occasional restarts are acceptable.
RTX 6000 Ada
The RTX 6000 Ada provides 48 GB VRAM with ECC memory support at approximately $6,800, targeting enterprise workstations and small-scale inference clusters. Memory bandwidth reaches 960 GB/s, slightly lower than the RTX 4090 but with significantly higher capacity for larger models.
ECC memory reduces silent data corruption in long-running inference workloads, particularly important for financial services and healthcare applications where output accuracy affects compliance. The dual-slot design and blower-style cooling enable dense rack mounting without thermal throttling.
Teams deploy RTX 6000 Ada cards in KServe inference services when 70B models require full precision for specific use cases or when model sovereignty concerns prevent aggressive quantization. The card supports virtualization through vGPU technology, allowing multiple containers to share GPU resources with SR-IOV.
Production deployments pair RTX 6000 Ada with Prometheus exporters to track GPU utilization, memory pressure, and thermal performance across inference pods. The professional driver stack provides better stability for 24/7 operations compared to consumer GeForce drivers.
L40S
The L40S combines 48 GB VRAM with PCIe 4.0 x16 connectivity at roughly $10,000, optimized for datacenter inference workloads without the premium of A100 or H100 pricing. Memory bandwidth reaches 864 GB/s, sufficient for 70B models with moderate request concurrency.
Passive cooling design requires proper airflow management in rack environments, with most deployments using 2U or 4U chassis with front-to-back cooling. The L40S lacks NVLink but supports GPUDirect RDMA for efficient multi-node communication in Ray Serve clusters.
Enterprise teams deploy L40S cards when building inference farms that prioritize VRAM capacity over raw bandwidth. A four-node cluster with dual L40S cards per node can serve 70B models to hundreds of concurrent users through vLLM’s continuous batching implementation.
The card’s tensor cores accelerate INT8 and FP16 inference, delivering 1.4 petaFLOPS of sparse tensor performance. KServe deployments with OpenTelemetry tracing show L40S achieving 92% GPU utilization during peak traffic when paired with appropriate request queuing strategies.
A100
The A100 40GB variant provides 1,555 GB/s memory bandwidth with NVLink support, enabling multi-GPU scaling for large model deployments at approximately $12,000 per card. The 80GB model doubles VRAM capacity at $18,000 but maintains identical bandwidth characteristics.
NVLink 3.0 connectivity at 600 GB/s between GPUs allows tensor parallelism for models exceeding single-GPU memory limits. Production deployments use NVIDIA’s Megatron-LM patterns through vLLM to split 175B models across multiple A100 cards with minimal communication overhead.
HBM2e memory architecture delivers consistent performance under sustained load, with thermal management supporting continuous 400W operation in properly cooled datacenters. The A100 supports Multi-Instance GPU (MIG) partitioning, allowing operators to slice a single card into seven isolated instances for multi-tenant serving.
Kubernetes deployments using the NVIDIA GPU Operator can dynamically allocate MIG slices to inference pods, maximizing utilization when serving multiple smaller models. Teams monitoring with Grafana dashboards track per-MIG-slice metrics including memory bandwidth utilization and SM occupancy.
H100
The H100 80GB delivers 3,350 GB/s memory bandwidth through HBM3 at approximately $30,000, doubling A100 throughput for large model inference. Fourth-generation tensor cores accelerate FP8 precision, achieving 3,958 TFLOPS for transformer architectures.
Production deployments achieve 25 tokens per second on Llama 3.3 70B without quantization, matching dual RTX 5090 performance at four times the cost. The H100’s value proposition centers on training workloads rather than inference-only deployments.
NVLink 4.0 provides 900 GB/s inter-GPU bandwidth, enabling efficient tensor and pipeline parallelism for 175B+ models. Teams running distributed inference with Ray Serve leverage NVSwitch fabrics to maintain sub-millisecond GPU-to-GPU latency across eight-card nodes.
The Confidential Computing capability supports encrypted inference workloads, protecting model weights and user prompts in multi-tenant environments. KServe deployments with secure enclaves meet regulatory requirements for financial and healthcare applications without performance penalties exceeding 8%.
CPU Inference
Modern CPUs with AVX-512 support can handle 7B models at roughly 15-20 tokens per second when using optimized runtimes such as llama.cpp, but CPU inference is rarely suitable for high-concurrency enterprise chat workloads.
CPU-only deployments are best reserved for embedding generation, low-volume back-office automation, offline batch summarization, and disaster-recovery environments where GPU capacity is unavailable.
The advantage is operational simplicity: commodity servers with high RAM capacity can run quantized GGUF models without specialized drivers or GPU scheduling.
The tradeoff is latency. Interactive workloads that require predictable time-to-first-token should remain on GPU-backed vLLM, TensorRT-LLM, or equivalent inference engines.
Implementation takeaway: Use CPU inference for resilience and low-volume automation, but avoid positioning it as the primary serving layer for multi-user enterprise AI systems.
Optimizing Memory Allocation and Throughput in Production
Production LLM deployments face critical bottlenecks in GPU memory management and request processing efficiency. Dynamic batching methods that monitor memory utilization and architectural optimizations like PagedAttention enable throughput gains of 8-28% while maintaining service-level agreements.
KV Cache
The key-value cache stores attention states from previously processed tokens, allowing models to avoid recomputing these values during autoregressive generation. A 70B parameter model with 4096 token context length consumes approximately 140GB of KV cache memory at fp16 precision across 80 attention layers.
Memory fragmentation and over-allocation waste 60-80% of allocated KV cache capacity in traditional implementations. Static allocation methods reserve maximum context length upfront, even when requests use shorter sequences.
This inefficiency limits batch sizes and reduces GPU utilization across production workloads.
Optimization approaches:
- Prefix caching: Shares common prompt prefixes across requests to reduce redundant storage
- Block-based allocation: Allocates cache in fixed-size blocks rather than contiguous arrays
- Quantized storage: Reduces KV cache precision to int8 or int4 for 50-75% memory savings
vLLM’s implementation achieves 2-4x higher throughput by eliminating fragmentation and enabling larger effective batch sizes. Teams implementing enterprise semantic caching AI can further reduce cache pressure by identifying and reusing semantically similar prompts.
Continuous Batching
Traditional static batching waits until a fixed batch size accumulates before processing, introducing latency for early-arriving requests and underutilizing GPUs when request rates drop. Continuous batching dynamically adds new requests to in-flight batches as soon as GPU resources become available from completed sequences.
Each request in an LLM batch completes at different iteration counts based on generated sequence length. Static batching forces all requests to wait until the longest sequence finishes, wasting compute cycles on padding tokens.
Continuous batching immediately reclaims freed KV cache slots and computation capacity. Implementation requires request-level scheduling rather than batch-level orchestration.
The scheduler tracks per-request state including current token position, KV cache allocation, and remaining budget. New requests join active batches between decoding iterations without synchronization barriers.
Performance characteristics:
| Metric | Static Batching | Continuous Batching |
|---|---|---|
| GPU Utilization | 45-60% | 75-85% |
| P95 Latency | 2.4s | 1.1s |
| Throughput Gain | Baseline | +40-60% |
Production deployments using vLLM or TensorRT-LLM benefit immediately from continuous batching without application code changes. The scheduler automatically balances throughput optimization against SLA constraints through configurable timeout policies.
Tensor Parallelism
Tensor parallelism splits individual weight matrices and computation across multiple GPUs, enabling models larger than single-device memory capacity. Each transformer layer’s attention and feedforward computations partition column-wise or row-wise across the parallelism degree.
A 70B parameter model requires approximately 140GB at fp16 precision, exceeding single A100 80GB capacity. 2-way tensor parallelism distributes the model across two GPUs, with each holding 70GB.
All-reduce collective operations synchronize activation tensors between matrix multiplication stages.
Communication overhead scales with parallelism degree:
- 2-way TP: 5-8% overhead
- 4-way TP: 12-18% overhead
- 8-way TP: 25-35% overhead
Optimal tensor parallelism degree balances memory requirements against communication costs. Teams should prioritize within-node parallelism using NVLink or NVSwitch interconnects before spanning network-connected nodes.
4-way TP across a single DGX node achieves 85-90% scaling efficiency. Tensor parallelism combines with pipeline parallelism for models exceeding single-node capacity.
The hybrid approach partitions layers across nodes while splitting each layer’s tensors within nodes. Ray Serve and KServe provide orchestration frameworks managing both parallelism strategies transparently.
PagedAttention
PagedAttention implements virtual memory concepts from operating systems for KV cache management, treating attention computations like page table lookups. The algorithm stores KV cache in non-contiguous memory blocks mapped through indirection tables, eliminating fragmentation from variable-length sequences.
Traditional attention requires contiguous KV cache allocation sized for maximum context length. A batch of 32 requests with 4096 token limit allocates 128K token slots regardless of actual usage.
PagedAttention allocates 64-token blocks on demand as sequences grow, achieving 80-95% memory utilization.
Block table structure:
Request 1: [Block 0] -> [Block 5] -> [Block 12]
Request 2: [Block 1] -> [Block 3]
Request 3: [Block 2] -> [Block 4] -> [Block 7] -> [Block 9]
Each block maintains physical GPU memory addresses while the block table provides logical sequence ordering. Attention kernels perform indirect lookups through the table during query-key-value operations.
The indirection overhead adds 3-5% computation compared to contiguous access patterns. vLLM pioneered PagedAttention for production LLM deployment, enabling batch sizes 2-3x larger than traditional serving frameworks.
The technique combines naturally with continuous batching by allocating and freeing blocks per-request rather than per-batch.
Speculative Decoding
Speculative decoding uses a small draft model to predict multiple future tokens, then validates predictions in parallel using the target model.
The approach reduces latency by amortizing target model inference costs across multiple tokens when predictions match.
A 7B draft model generates 4-8 candidate tokens in 15-20ms.
The 70B target model verifies all candidates simultaneously in 80-100ms rather than running 4-8 sequential iterations at 80-100ms each.
Accepted predictions save 60-75% of target model iterations on typical completions.
Acceptance rates by domain:
- Code generation: 65-75%
- Question answering: 55-70%
- Structured summarization: 50-65%
- Creative writing: 35-50%
Speculative decoding works best when the draft model is aligned with the target model and the workload has predictable token patterns.
It is less effective for highly creative responses or domain-specific reasoning where the small draft model frequently predicts tokens that the larger model rejects.
Implementation takeaway: Benchmark speculative decoding with the enterprise workload rather than assuming universal latency gains.
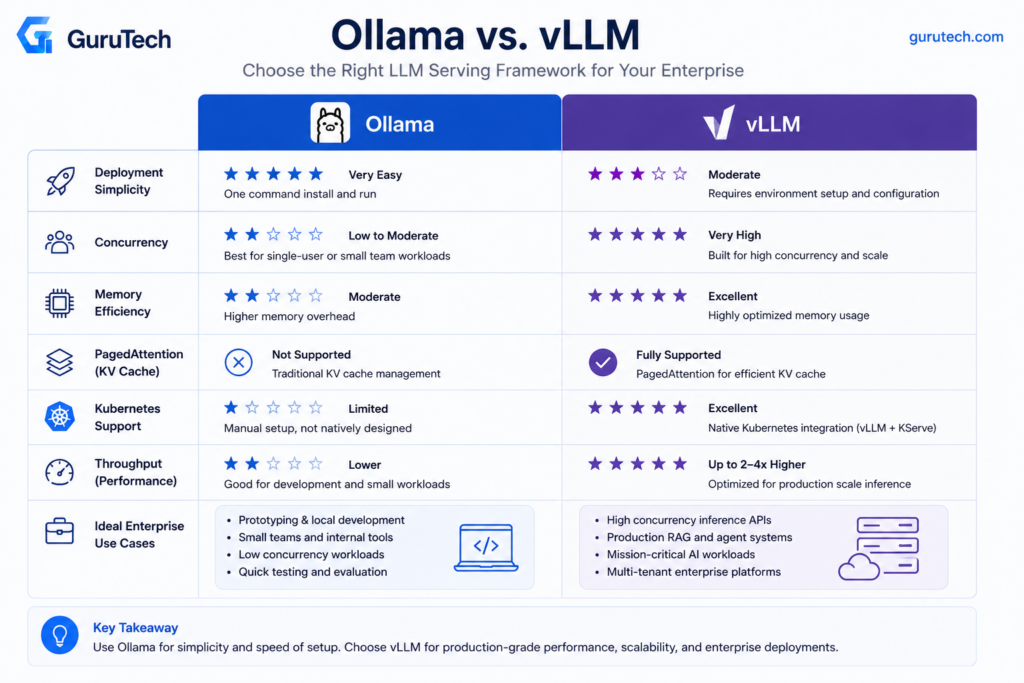
Choosing Between Ollama and vLLM for Enterprise Workloads
Ollama vs vLLM decisions hinge on concurrent user load and infrastructure complexity tolerance.
vLLM optimizes for multi-tenant production environments with PagedAttention and continuous batching, while Ollama prioritizes deployment simplicity for single-user workflows and development environments.
Ollama vs vLLM Comparison Table
| Factor | Ollama | vLLM |
|---|---|---|
| Concurrent Users | Single user, queued requests | Hundreds of simultaneous users per instance |
| Inference Engine | None (server only) | PagedAttention + continuous batching |
| GPU Utilization | Basic optimization | Advanced memory management and batching |
| Setup Complexity | Single command (ollama run) | Requires distributed inference configuration |
| Throughput (tokens/sec) | Lower under load | Optimized for maximum throughput |
| Kubernetes Integration | Limited | Native support with KServe and Ray Serve |
| Memory Efficiency | Standard KV cache | PagedAttention reduces memory overhead by 2-4x |
| Best For | Local dev, prototyping, demos | Production deployments, API serving, multi-tenant |
Infrastructure teams running production LLM workloads on NVIDIA A100 or H100 clusters see vLLM deliver 3-5x higher throughput than Ollama under concurrent load.
Ollama excels in edge deployments and developer laptops where setup friction matters more than serving capacity.
vLLM requires parameter-efficient fine-tuning expertise and distributed inference knowledge to maximize ROI.
Ollama abstracts these complexities but sacrifices scalability, making it unsuitable for customer-facing applications with variable traffic patterns.
Why llama.cpp and Hugging Face TGI Are Not the Primary Focus
llama.cpp serves as Ollama’s foundation but requires manual compilation and configuration management that Ollama automates.
Enterprise teams choose Ollama over raw llama.cpp for dependency management and model lifecycle automation, not inference performance.
Hugging Face Text Generation Inference (TGI) competes directly with vLLM but lacks PagedAttention’s memory efficiency advantages in high-concurrency scenarios.
Benchmarks on RTX 4090 and A100 GPUs show vLLM consistently outperforming TGI by 20-40% on throughput when serving 50+ concurrent requests.
The comparison focuses on Ollama and vLLM because they represent the most common enterprise deployment patterns: development-focused simplicity versus production-optimized scalability.
TGI remains relevant for teams heavily invested in Hugging Face ecosystems, while llama.cpp appeals to embedded systems requiring minimal dependencies.
Platform engineers integrate vLLM with Prometheus and Grafana to track GPU memory fragmentation and batch efficiency metrics that directly impact cost per inference.
Code-Level Implementation of a Production vLLM Server
Production vLLM deployments require explicit server configuration through command-line parameters and programmatic client interactions that respect OpenAI API conventions while leveraging vLLM-specific optimizations for throughput and memory efficiency.
Shell Example
The vLLM production stack deployment begins with server instantiation through explicit shell commands that define GPU allocation, tensor parallelism, and memory management policies.
Engineers launch vLLM servers with parameters that directly control PagedAttention block sizes, KV cache limits, and swap space allocation.
vllm serve meta-llama/Llama-3.1-70B-Instruct \
  --tensor-parallel-size 4 \
  --gpu-memory-utilization 0.95 \
  --max-model-len 32768 \
  --dtype bfloat16 \
  --kv-cache-dtype fp8 \
  --enable-prefix-caching \
  --disable-log-requests
The --gpu-memory-utilization parameter controls what percentage of available VRAM vLLM reserves for model weights and KV cache blocks.
Setting this above 0.90 maximizes throughput but leaves minimal headroom for request spikes.
The --kv-cache-dtype fp8 flag reduces memory consumption by 50% compared to fp16, enabling longer context windows on fixed hardware.
Tensor parallelism splits model layers across multiple GPUs within a single node, requiring NVLink or PCIe bandwidth proportional to batch size and sequence length.
Engineers typically reserve one GPU per 20B parameters as a baseline sizing heuristic.
Python OpenAI Client Example
Client applications interact with vLLM through the OpenAI Python SDK, maintaining code portability across inference backends while accessing vLLM-specific performance characteristics.
The async client pattern enables concurrent request batching that maximizes GPU utilization during variable load conditions.
from openai import AsyncOpenAI

client = AsyncOpenAI(
    base_url="http://vllm-router-service:30080/v1",
    api_key="not-required-for-vllm"
)

async def generate_completion(prompt: str, model: str):
    response = await client.completions.create(
        model=model,
        prompt=prompt,
        max_tokens=512,
        temperature=0.7,
        stream=False
    )
    return response.choices[0].text
Async patterns become critical when implementing production features like request hedging, timeout management, and parallel batch processing.
Engineers building AI Token Observability Dashboard integrations capture per-request metrics through response headers that expose queue time, execution time, and token throughput.
The chat completions endpoint supports structured outputs and function calling when models include appropriate training.
Platform teams standardize on chat rather than completions for new implementations to maintain compatibility with instruction-tuned model formats.
OpenAI-Compatible Endpoint
vLLM exposes OpenAI-compatible REST endpoints at /v1/completions, /v1/chat/completions, and /v1/models, enabling production vLLM deployment behind standard reverse proxy configurations.
The API surface maintains behavioral parity with OpenAI’s specification while adding vLLM-specific extensions for advanced batching control.
| Endpoint | Method | Purpose | vLLM Extension |
|---|---|---|---|
/v1/models | GET | List available models | Returns tensor parallel config |
/v1/completions | POST | Text completion | Supports ignore_eos parameter |
/v1/chat/completions | POST | Chat-formatted completion | Streaming via server-sent events |
/metrics | GET | Prometheus metrics | GPU utilization, queue depth |
The /metrics endpoint exposes Prometheus-formatted telemetry including vllm:num_requests_running, vllm:gpu_cache_usage_perc, and per-model request latency histograms.
Platform teams integrate these metrics with Enterprise Semantic Caching monitoring to correlate cache hit rates with reduced GPU load.
Production Parameters Only
Production vLLM configurations require explicit tuning of memory management, batching behavior, and observability parameters that differ substantially from development defaults.
Engineers focus on six critical server flags that determine throughput ceiling and failure modes under load.
Memory Configuration:
--max-num-batched-tokens: Controls maximum tokens processed per forward pass (default 2560, increase to 8192+ for throughput)--max-num-seqs: Maximum concurrent sequences in batch (default 256, limit based on VRAM)--swap-space: CPU RAM allocated for KV cache offloading in GiB (2-4 GiB typical)
Performance Tuning:
--enable-prefix-caching: Enables prompt prefix reuse across requests (critical for Evaluation Frameworks for GenAI Production Systems)--enable-chunked-prefill: Splits long prefills across iterations to reduce latency spikes--max-model-len: Enforces context window ceiling to prevent OOM errors
The chunked prefill feature trades increased time-to-first-token for reduced P99 latency variance by processing long prompts incrementally.
Engineers typically enable this when serving traffic patterns with mixed sequence lengths where occasional 10K+ token prefills would otherwise block short requests.
Model-aware routing in the vLLM production stack distributes requests across replicas based on prefix cache affinity and current queue depth rather than simple round-robin load balancing.
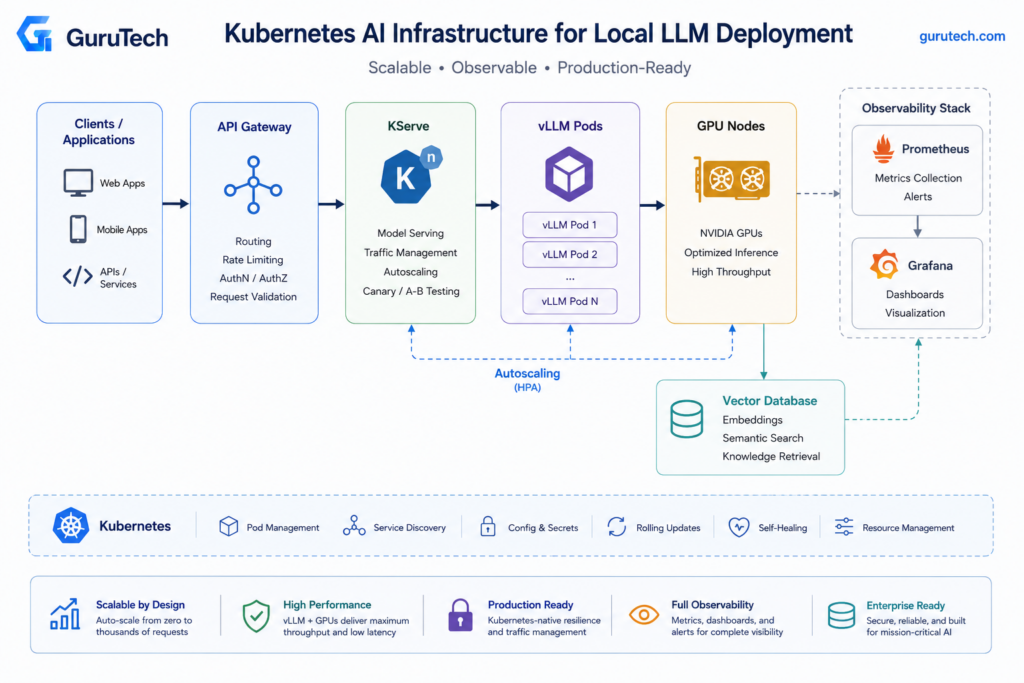
Scaling AI Clusters with Kubernetes
Enterprise AI workloads require orchestration frameworks that handle GPU scheduling, dynamic model loading, and horizontal scaling across multiple nodes.
Production deployments typically rely on specialized serving platforms like KServe and Ray Serve combined with NVIDIA’s GPU Operator for resource management.
KServe
KServe provides a Kubernetes-native serving layer for machine learning models through custom resource definitions.
Teams deploy InferenceService objects that automatically provision pods, configure autoscaling policies, and expose prediction endpoints without writing deployment manifests manually.
The framework integrates with Istio or Knative for traffic splitting during canary deployments.
Engineers can route 10% of inference traffic to a new model version while monitoring latency and accuracy metrics before full rollout.
KServe enables production-ready LLM deployments through its abstraction of complex serving infrastructure.
KServe supports multiple runtimes including vLLM, TensorRT-LLM, and Triton Inference Server.
The ModelMesh component enables multi-tenant serving where dozens of smaller models share GPU memory through dynamic loading and unloading based on request patterns.
Production teams configure resource limits at the InferenceService level rather than raw pod specifications.
This approach ensures consistent GPU allocation policies across model versions and simplifies capacity planning for platform teams managing shared infrastructure.
Ray Serve
Ray Serve excels at orchestrating complex AI applications that combine multiple models, vector databases, and business logic in distributed compute graphs.
Unlike simple model servers, it manages stateful workloads across clusters with built-in placement strategies for GPU and CPU resources.
The framework handles request batching automatically and supports streaming responses for LLM inference workloads.
Engineers define deployments as Python classes with explicit resource requirements, allowing Ray’s scheduler to optimize placement across heterogeneous node pools.
Ray Serve integrates with Ray’s distributed compute primitives for preprocessing pipelines and ensemble inference.
A single Ray cluster can run data ingestion jobs, fine-tuning workloads, and production inference simultaneously with isolation guarantees through placement groups.
Autoscaling in Ray Serve operates at both the replica level and cluster level.
The system monitors queue depth and latency targets to scale individual deployments while the Ray Autoscaler provisions or terminates nodes based on resource demands across all workloads.
GPU Operator
NVIDIA’s GPU Operator manages the complete GPU software stack as containerized components within Kubernetes.
It deploys the NVIDIA driver, container runtime, device plugin, and DCGM exporter as DaemonSets across GPU nodes.
Platform teams no longer maintain host-level NVIDIA drivers on each node.
The operator handles driver compatibility, updates, and configuration through Kubernetes-native workflows.
This approach reduces operational overhead in multi-tenant clusters where different workloads require specific CUDA versions.
The GPU Operator exposes extended resources like nvidia.com/gpu that pods request in resource specifications.
It also enables GPU time-slicing for development environments and MIG (Multi-Instance GPU) partitioning on A100 and H100 hardware for better utilization.
| Component | Function | Production Benefit |
|---|---|---|
| NVIDIA Driver | GPU kernel module | Containerized driver updates |
| Container Toolkit | Runtime integration | Consistent CUDA environment |
| Device Plugin | Resource discovery | Kubernetes-native scheduling |
| DCGM Exporter | Metrics collection | GPU utilization observability |
Monitoring GPU health requires the DCGM exporter metrics in Prometheus.
Teams track DCGM_FI_DEV_GPU_UTIL, DCGM_FI_DEV_MEM_COPY_UTIL, and DCGM_FI_DEV_GPU_TEMP to detect thermal throttling and memory bottlenecks that degrade inference throughput.
Helm
Helm charts package complex Kubernetes manifests into versioned, templatable releases for LLM serving stacks.
Platform teams create charts that encapsulate deployment best practices including resource limits, security policies, and monitoring configurations.
Production charts parameterize critical values like model paths, GPU counts, and replica counts through values.yaml files.
Engineers override defaults per environment without modifying templates, ensuring consistency between staging and production deployments.
Charts for vLLM or TGI typically include ConfigMaps for runtime parameters, Secrets for model registry credentials, and ServiceMonitor objects for Prometheus integration.
The chart structure enforces standards across teams deploying different models.
Helm’s release management tracks deployment history and enables atomic rollbacks when new model versions degrade performance.
Teams run helm rollback to revert to previous configurations within seconds rather than debugging failed deployments manually.
Autoscaling
Horizontal Pod Autoscaling for LLM workloads requires custom metrics beyond CPU utilization.
Production deployments scale on requests per second, queue depth, or P95 latency exposed through the Prometheus Adapter.
The Kubernetes HPA controller queries custom metrics every 15 seconds by default.
Teams configure the --horizontal-pod-autoscaler-sync-period flag and set appropriate target values that balance latency requirements against cold start costs for new pods.
GPU workloads require cluster-level autoscaling through the Cluster Autoscaler or Karpenter.
These controllers provision new nodes when pending pods cannot schedule due to resource constraints.
Node warm-up time for GPU instances often exceeds 5 minutes, making over-provisioning strategies essential for traffic spikes.
KEDA (Kubernetes Event-Driven Autoscaling) enables scaling based on external metrics like message queue depth or database query counts.
AI agents that process asynchronous tasks benefit from KEDA’s integration with Redis streams, RabbitMQ, and cloud-native queuing services.
Platform teams combine HPA and cluster autoscaling with node affinity rules to separate inference workloads from training jobs.
Taints on GPU nodes with workload=inference:NoSchedule prevent batch jobs from consuming capacity reserved for latency-sensitive serving.
Multi-Node Inference
Large models exceeding single-GPU memory capacity require tensor parallelism across multiple devices.
Production LLM deployment architectures distribute model layers across GPUs within a node or across nodes using high-bandwidth interconnects.
Advanced Monitoring of AI Model Serving Pipelines
Production LLM deployments require continuous telemetry across GPU resources, inference latency, throughput characteristics, and request queue behavior.
Effective monitoring captures both infrastructure-level signals and application-specific metrics that directly impact user experience and operational costs.
GPU Utilization
GPU utilization measures the percentage of time the GPU compute cores are actively processing work.
For LLM inference workloads, sustained utilization above 80% indicates the serving layer is effectively batching requests and minimizing idle cycles.
Low utilization (below 40%) signals either insufficient request volume to justify the hardware or inefficient batching configuration in the inference engine.
The metric requires disambiguation between compute utilization and memory bandwidth utilization.
Memory-bound workloads, which characterize most LLM serving, can show moderate compute utilization (50-70%) while the memory subsystem operates at capacity.
Tools like nvidia-smi dmon or dcgm-exporter expose both metrics through separate counters.
Monitor per-GPU utilization when running tensor parallelism across multiple devices.
Unbalanced utilization across GPUs in a tensor-parallel group indicates inefficient workload distribution or PCIe bandwidth bottlenecks.
NVLink-connected GPUs should show near-identical utilization patterns within 5-10% variance.
Tokens/Sec
Throughput measured in tokens per second represents the aggregate output rate across all concurrent requests.
This metric directly translates to infrastructure efficiency and operational cost per token generated.
A dual-H100 system serving a quantized 70B model with vLLM typically achieves 2,000-4,000 tokens/sec under optimal batching conditions.
Throughput scales with batch size until memory bandwidth saturation or KV cache exhaustion occurs.
Continuous batching engines like vLLM dynamically adjust batch composition as requests arrive and complete, maintaining higher average throughput than static batching approaches.
Teams should track tokens/sec alongside active request count to calculate per-request throughput and identify degradation patterns.
vLLM throughput benchmarking requires standardized prompt lengths and output token counts to ensure reproducible results across configuration changes.
Vary --max-model-len and --gpu-memory-utilization parameters while measuring tokens/sec to identify the optimal configuration for the target workload’s request distribution.
TTFT
Time to First Token measures the latency from request arrival to the first generated token returning to the client.
TTFT directly impacts perceived responsiveness for interactive applications like coding assistants and customer-facing chatbots.
Production systems should target P50 TTFT below 50ms and P99 below 200ms for user-facing workloads.
The metric captures prefill latency, which depends on prompt length and current batch composition.
Longer prompts require more compute to process the input tokens before generation begins.
Disaggregated prefill architectures, where dedicated GPU resources handle prompt processing separately from token generation, can reduce TTFT variability under load.
Monitor TTFT distribution across prompt length buckets.
A system showing consistent TTFT for 100-token prompts but degraded TTFT for 2,000-token prompts indicates prefill compute capacity limitations rather than decode bottlenecks.
P95 Latency
P95 latency represents the latency threshold below which 95% of requests complete.
This percentile matters more than average latency for production systems because it captures the experience of the slowest 5% of users before reaching true tail behavior.
Infrastructure teams typically set SLO targets at P95 rather than P50 or P99 to balance user experience with operational feasibility.
The metric aggregates total request duration from arrival to completion, including queueing time, prefill latency, and decode time across all generated tokens.
Sharp increases in P95 latency often indicate system saturation where the request queue depth is growing faster than the serving layer can process requests.
Track P95 latency separately for different request types when serving multiple models or handling diverse workload patterns.
A RAG application might maintain separate P95 targets for embedding requests (10-20ms) versus generation requests (500-1000ms) because the performance characteristics differ fundamentally.
Queue Depth
Queue depth counts the number of requests waiting for processing resources at any given time.
The metric serves as an early warning signal for capacity exhaustion before latency degradation becomes severe.
A consistently growing queue indicates insufficient serving capacity for the incoming request rate.
Inference engines maintain internal queues where requests wait for GPU availability and batch slot assignment.
vLLM exposes queue depth through Prometheus metrics at /metrics.
Teams should alert when queue depth exceeds a threshold calculated from target latency and observed throughput (e.g., if target latency is 1 second and throughput is 100 req/sec, alert at queue depth above 100).
Analyze queue depth patterns alongside request arrival rate to size autoscaling policies.
Bursty workloads require more aggressive scale-out triggers than steady-state traffic to prevent queue accumulation during traffic spikes.
Prometheus
Prometheus collects time-series metrics from instrumented applications through a pull-based HTTP scraping model.
The vLLM inference server exposes metrics at /metrics in Prometheus format, including GPU utilization, active requests, queue depth, and request latency histograms.
Configure Prometheus to scrape vLLM endpoints every 15-30 seconds to capture sufficient granularity without overwhelming the metrics pipeline.
The platform supports multi-dimensional metrics with labels, allowing teams to slice throughput and latency by model name, request type, or client identifier.
Define recording rules to pre-compute high-cardinality aggregations like per-minute token throughput or P95 latency by endpoint, reducing query load on the Prometheus server.
Deploy Prometheus with persistent storage backed by local SSDs or network-attached volumes to retain metrics history for capacity planning and incident retrospectives.
A 90-day retention window typically requires 1-2 GB of storage per monitored endpoint depending on metric cardinality.
Grafana
Grafana visualizes Prometheus time-series data through dashboards that combine GPU telemetry, inference metrics, and application-level KPIs.
Platform teams should build dashboards showing GPU utilization, tokens/sec, TTFT distribution, P95 latency, and queue depth on a single view to correlate infrastructure behavior with application performance.
Use template variables to create reusable dashboards that filter by model name, deployment environment, or GPU node.
This approach scales monitoring across multiple inference deployments without duplicating dashboard configurations.
Configure alert rules within Grafana to trigger notifications when queue depth exceeds thresholds or P95 latency violates SLO targets.
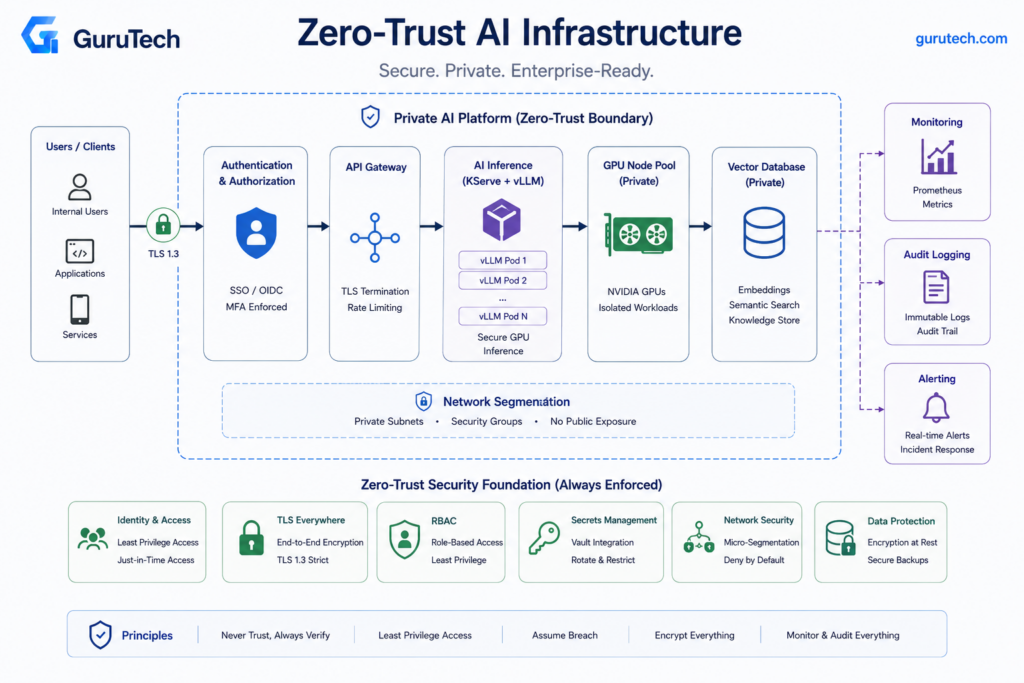
Implementing Zero-Trust Security in AI Deployments
Enterprise LLM deployments require strict identity verification, encrypted communication channels, granular access controls, and comprehensive audit trails at every layer of the infrastructure stack.
Applying zero-trust principles to AI systems means treating model endpoints, training pipelines, and data flows as untrusted by default.
TLS
All network communication in LLM deployments must use mutual TLS (mTLS) between services, including connections between inference servers, vector databases, and application layers.
KServe deployments on Kubernetes should enforce TLS termination at the ingress controller with automatic certificate rotation via cert-manager.
Organizations running vLLM or Ollama instances need to configure TLS at the reverse proxy layer using nginx or Envoy with Let’s Encrypt certificates for external endpoints.
Internal service mesh implementations with Istio or Linkerd provide automatic mTLS between pods without application code changes.
Ray Serve clusters require explicit TLS configuration for both the dashboard and serve endpoints through the ray.init() parameters.
Certificate pinning becomes critical when LLM applications connect to external embedding APIs or retrieval services.
Teams should implement certificate transparency monitoring to detect unauthorized certificate issuance for their AI infrastructure domains.
OAuth
OAuth 2.0 with JWT tokens provides the authentication foundation for LLM API endpoints, replacing API keys that cannot be scoped or revoked granularly.
Kubernetes deployments should integrate with enterprise identity providers through OIDC, allowing centralized token management and automatic expiration.
vLLM deployments can enforce OAuth at the application gateway layer using Kong or Tyk, validating JWT signatures before requests reach the inference engine.
Token scopes must define specific permissions like model access, batch inference rights, or fine-tuning capabilities rather than broad service-level access.
Organizations implementing GraphRAG Architecture need separate OAuth scopes for graph traversal, vector search, and LLM inference to prevent lateral movement after credential compromise.
Short-lived tokens with 15-minute expiration and refresh token rotation reduce the blast radius of leaked credentials.
Service accounts for automated pipelines should use workload identity federation instead of long-lived credentials.
RBAC
Role-based access control in LLM infrastructure requires distinct permissions for model developers, inference users, and operations teams across the deployment lifecycle.
Kubernetes RBAC policies should separate namespace access for training workloads, serving infrastructure, and monitoring systems.
| Role | Permissions | Scope |
|---|---|---|
| ML Engineer | Create training jobs, read model artifacts | Training namespace |
| Inference User | POST to /v1/completions, view quota | Serving namespace |
| Platform Ops | Update deployments, scale replicas | Cluster-wide |
| Security Audit | Read logs, view metrics | Read-only global |
KServe InferenceService resources need custom RBAC rules that prevent inference users from modifying model URIs or container images.
Teams deploying Multi-Agent Orchestration Frameworks must implement fine-grained permissions for agent creation, tool access, and inter-agent communication channels.
Ray clusters require application-level RBAC since Kubernetes permissions don’t extend to Ray’s internal job scheduling.
Organizations should implement custom authorization middleware that validates user roles against specific model endpoints or dataset access patterns.
Air-Gapped Deployments
Air-gapped LLM infrastructure eliminates internet connectivity entirely, requiring local container registries, model repositories, and dependency mirrors within the security boundary.
Teams must establish one-way data diodes for model weight transfers from external training environments to production inference clusters.
Harbor or Artifactory deployments need sufficient storage for multi-terabyte model artifacts including Llama 3.1 405B weights and associated tokenizers.
Container images for vLLM, TensorRT-LLM, and NVIDIA Triton must be scanned, signed, and transferred through approved channels before air-gap ingress.
Python package dependencies require local PyPI mirrors with all transitive dependencies pre-downloaded, as pip cannot resolve packages at runtime.
NVIDIA GPU driver updates and CUDA toolkit versions need manual synchronization schedules since automatic driver updates are impossible.
Enterprise Semantic Caching implementations in air-gapped environments must use Redis or Valkey clusters deployed within the security boundary rather than managed cache services.
Vector databases like Milvus or Qdrant require local deployment with backup strategies that don’t rely on cloud storage.
Secrets Management
LLM deployments require secure storage for model decryption keys, database credentials, API tokens, and encryption keys used in AI Token Observability Dashboard implementations.
HashiCorp Vault or AWS Secrets Manager with VPC endpoints should provision secrets dynamically rather than mounting static files.
Kubernetes External Secrets Operator synchronizes secrets from central vaults into cluster namespaces, rotating credentials on configurable schedules.
KServe deployments can inject secrets as environment variables or mounted volumes without hardcoding values in InferenceService manifests.
Organizations using OpenAI-compatible endpoints for internal LLMs must rotate API keys every 30 days and implement key versioning to prevent service disruption.
Model weights stored in encrypted S3 buckets or blob storage need KMS keys with restricted IAM policies that prevent mass data exfiltration.
Training jobs require temporary credentials with write access to model checkpoints but inference workloads should only receive read permissions.
Ray autoscaling clusters need service account keys injected at node creation time through instance metadata or cloud-init scripts.
Network Segmentation
Production LLM infrastructure requires isolated network zones for training, inference, data preprocessing, and monitoring with explicit firewall rules between segments.
Kubernetes NetworkPolicies should deny all traffic by default, allowing only labeled pods to communicate with specific services.
| Network Zone | Allowed Inbound | Allowed Outbound |
|---|---|---|
| Inference | API Gateway | Vector DB, Model Storage |
| Training | Job Scheduler | Dataset Storage, Checkpoint Storage |
| Data Prep | Orchestrator | Raw Data, Processed Data |
| Monitoring | Prometheus, Grafana | All zones (read-only metrics) |
Enterprise-grade security practices for local LLM deployments recommend separate VPCs or VNets for GPU training clusters and CPU inference endpoints to prevent credential exposure.
vLLM instances should never have direct database access; retrieval services in an intermediate zone should fetch context and pass sanitized data.
NVIDIA GPU nodes require dedicated subnets with high-bandwidth east-west connectivity, restricted ingress, and no direct internet exposure.
Only model-serving control planes, observability collectors, and approved retrieval services should communicate with GPU workers.
Outbound egress should be denied by default so compromised inference containers cannot download unapproved model weights, call external APIs, or exfiltrate prompts.
Implementation takeaway: Segment GPU inference nodes as sensitive compute assets and force all access through authenticated, logged, and policy-controlled gateways.
Frequent Pitfalls in On-Premises Model Serving
Most deployment failures stem from VRAM miscalculation, lack of request batching, and missing observability pipelines.
Teams underestimate the operational overhead of authentication, monitoring, and GPU utilization tuning required for production stability.
Oversized Models
Deploying a 70B parameter model when a 13B or 7B variant would meet accuracy requirements wastes GPU resources and increases latency.
Organizations often default to the largest available model under the assumption that bigger means better, but enterprise deployment strategies require matching model size to use-case requirements.
Benchmark smaller models against production evaluation criteria before committing hardware.
A quantized Llama 3.1 13B at INT4 delivers 95-98% of the accuracy of its 70B counterpart on many domain-specific tasks while requiring only 7-8 GB VRAM versus 38-42 GB.
The latency improvement is substantial—P50 time-to-first-token drops from 25-30ms to 8-12ms on H100 hardware.
Run systematic evaluations using task-specific benchmarks rather than general leaderboards.
If the 13B model meets SLA requirements for accuracy and the use case doesn’t demand frontier reasoning capabilities, the cost savings in hardware, power, and cooling justify the choice.
VRAM Exhaustion
Running out of GPU memory mid-request crashes inference servers and requires container restarts.
Teams miscalculate total VRAM requirements by accounting only for model weights, ignoring KV cache growth, framework overhead, and batching buffers.
The calculation: model weights + KV cache (scales with context length × batch size) + 2-4 GB CUDA runtime + batching overhead.
For a 70B AWQ model at 38 GB weights serving 4096-token contexts with batch size 16, expect 38 GB weights + 6-8 GB KV cache + 3 GB runtime = 47-49 GB total.
Allocate 10-15% headroom above calculated requirements to handle request spikes.
Configure --gpu-memory-utilization in vLLM to 0.85-0.90 rather than the default 0.95.
This prevents out-of-memory errors during traffic bursts when multiple large requests arrive simultaneously.
Monitor actual VRAM usage via nvidia-smi dmon -s u and adjust allocation based on P95 observed usage.
Set Kubernetes resource limits to match physical VRAM minus the reserved margin.
Without hard limits, runaway memory allocation from one container can destabilize the entire node.
No Batching
Serving requests one at a time leaves the GPU idle during memory transfers, wasting 60-80% of available throughput.
Continuous batching engines like vLLM and TensorRT-LLM dynamically group requests to maximize GPU utilization during both prefill and decode phases.
Without batching, a single H100 might process 15-20 requests per second at 4096-token context length.
Continuous batching increases that to 80-120 requests per second by overlapping computation across multiple requests.
The GPU remains busy executing matrix multiplications while waiting for memory bandwidth to deliver the next batch of activations.
Configure --max-num-batched-tokens and --max-num-seqs in vLLM to balance latency and throughput.
Setting --max-num-seqs 64 allows up to 64 concurrent requests in flight, but if average prompt length is 2048 tokens, total batched tokens will exceed memory capacity.
Tune both parameters together based on observed prompt length distributions.
Disaggregated serving architectures separate prefill (prompt processing) from decode (token generation) to optimize each phase independently, but add complexity.
Start with unified continuous batching before introducing disaggregation.
Missing Observability
Production LLM infrastructure requires token-level telemetry, GPU metrics, and request tracing to diagnose performance degradation.
Teams deploy inference servers without Prometheus exporters, distributed tracing, or structured logging, then spend days troubleshooting latency spikes.
Export vLLM metrics to Prometheus using the built-in /metrics endpoint.
Key metrics: vllm:num_requests_running, vllm:gpu_cache_usage_perc, vllm:time_to_first_token_seconds, and vllm:time_per_output_token_seconds.
Graph these in Grafana alongside GPU utilization from dcgm-exporter for NVIDIA Data Center GPU Manager metrics.
Implement distributed tracing with OpenTelemetry to track request flow from ingress through authentication, caching layers, and inference.
Trace context propagation reveals whether latency spikes originate in the model, batching queue, or upstream services.
| Metric | Target | Alert Threshold |
|---|---|---|
| P50 TTFT | < 30ms | > 50ms |
| P99 TTFT | < 100ms | > 200ms |
| GPU Utilization | > 70% | < 50% |
| KV Cache Usage | < 85% | > 90% |
Track token throughput separately for prefill and decode phases.
Prefill is compute-bound; decode is memory-bandwidth-bound.
If GPU utilization drops during decode, the bottleneck is VRAM bandwidth, not compute.
Ignoring Authentication
Exposing inference endpoints without authentication allows internal users to bypass rate limits and external attackers to exfiltrate model weights through timing attacks.
Common deployment mistakes include shipping API servers with default configurations that accept unauthenticated requests.
Implement API key authentication at minimum.
Pass --api-key to vLLM and require clients to include Authorization: Bearer <token> headers.
For multi-tenant environments, integrate with OAuth2 or OIDC providers to enforce per-user identity and audit logging.
Rate limiting prevents resource exhaustion from runaway clients or deliberate abuse.
Deploy nginx or Envoy in front of inference servers with per-client token bucket rate limits.
Set limits based on expected legitimate usage—if internal teams average 10 requests per minute, limit to 50 requests per minute with a short burst allowance.
Every request should be attributable to a user, service account, project, and cost center so security teams can investigate abnormal token consumption or suspicious prompt patterns.
Implementation takeaway: Never expose local inference endpoints as anonymous internal services; authentication and rate limits are part of the production architecture.
Summary: Architecting Secure, Production-Ready AI Clusters
Building production-grade local LLM systems requires three decoupled layers: presentation (UI), governance (gateway), and compute (inference).
Teams should implement mutual TLS between all components, encrypt model artifacts at rest using LUKS or dm-crypt, and enforce JWT-based authentication at the API gateway.
Zero-trust networking prevents lateral movement if a node is compromised.
Hardware selection directly impacts GPU utilization and memory efficiency.
RTX 4090 cards deliver 24GB VRAM at $1,600 per unit, while A100 cards provide 80GB with tensor parallelism support at $10,000+.
CPU nodes handle embedding retrieval and preprocessing workloads where GPU allocation would be wasteful.
| Framework | Throughput | Quantization | Best For |
|---|---|---|---|
| vLLM + Ray Serve | 700+ tok/s | 4-bit, 8-bit | Multi-GPU clusters |
| llama.cpp | 50-100 tok/s | GGUF formats | Single-node deployments |
| DeepSpeed | Variable | ZeRO-3 offload | 100B+ parameter models |
Observability requires Prometheus metrics for gpu_memory_used_bytes, inference_latency_p99, and model_queue_depth.
Grafana dashboards should track GPU utilization trends across the cluster to identify bottlenecks.
OpenTelemetry traces reveal end-to-end request flows through the orchestration layer.
Managing personal compute clusters requires scheduler intelligence that routes requests based on current node load, model compatibility, and SLA requirements.
Ray Serve handles dynamic batching and speculative decoding for throughput optimization.
Teams running healthcare or financial workloads must ensure all data stays on-premises to satisfy GDPR, HIPAA, or corporate compliance policies.
Model versioning in MinIO or S3-compatible storage enables rollback capabilities when inference quality degrades.
SHA-256 checksums verify artifact integrity before deployment to prevent corrupted weights from reaching production nodes.
Final Thoughts on Local LLM Deployment Infrastructure
Local LLM deployment infrastructure is not automatically cheaper or simpler than cloud API usage.
It becomes valuable when the organization has sustained inference demand, strict data residency obligations, sensitive customer payloads, predictable internal workloads, or a strategic need to control model behavior and versioning.
The strongest architecture is usually hybrid.
Enterprises can keep regulated workloads on-premise while using cloud APIs for experimentation, low-risk prototypes, or overflow capacity during traffic spikes.
This allows platform teams to avoid overbuilding GPU clusters before usage patterns are proven.
The practical decision should be based on workload measurement rather than AI infrastructure hype.
Before buying hardware, teams should benchmark representative prompts, expected context windows, concurrency, token output length, latency targets, and security requirements.
Once those numbers are known, the deployment path becomes clearer: Ollama for local development, vLLM for high-throughput serving, KServe or Ray Serve for orchestration, and Prometheus/Grafana/OpenTelemetry for production observability.
For system architects building private AI deployment roadmaps, the key question is no longer whether local models can run in enterprise environments.
The real question is whether the organization can operate the surrounding infrastructure with the same discipline it applies to databases, Kubernetes platforms, and regulated production systems.
Call to action: If your team is planning a self-hosted LLM enterprise deployment, comment below with your target model size, GPU layout, expected concurrency, and biggest infrastructure bottleneck.
Frequently Asked Questions
Production LLM deployments require careful consideration of model selection, infrastructure design, capacity planning, security pipelines, orchestration patterns, and observability architecture to meet enterprise SLAs and compliance requirements.
What is local LLM deployment infrastructure?
Local LLM deployment infrastructure is the hardware, software, networking, security, and observability stack required to run language models inside an organization’s own environment.
It typically includes GPU servers, model-serving engines such as vLLM or Ollama, API gateways, authentication, vector databases, monitoring dashboards, Kubernetes orchestration, and secure storage for model artifacts.
Which open-source LLMs are viable for on-prem production use given VRAM requirements, context length, and licensing constraints?
Llama 3 family models, Mistral models, Mixtral, Qwen, and selected enterprise-focused models are common candidates for private AI deployment.
The right choice depends on commercial licensing, model quality, context window, quantization support, available VRAM, and whether the workload requires reasoning, summarization, code generation, retrieval augmentation, or multilingual support.
Teams should maintain a model registry with license metadata, checksums, benchmark results, and approved deployment configurations.
Is Ollama production ready?
Ollama is excellent for developer workstations, local testing, demonstrations, edge use cases, and small internal tools.
For high-concurrency production applications, vLLM is usually stronger because it provides continuous batching, PagedAttention, OpenAI-compatible serving, better throughput under load, and cleaner integration with Kubernetes-based serving platforms.
Enterprises can still use Ollama as part of the development lifecycle before promoting validated models to a production vLLM or KServe environment.
Why is vLLM faster than Ollama for enterprise workloads?
vLLM is optimized for multi-user inference serving, especially under concurrent request loads.
Its PagedAttention memory management reduces KV cache fragmentation, while continuous batching keeps GPUs busier by adding and removing requests dynamically during decoding.
These optimizations matter most when many users or applications send requests at the same time.
How much VRAM does a local LLM deployment need?
VRAM depends on model size, precision, quantization method, context length, and concurrency.
A 7B model may run comfortably on 8-16GB of VRAM when quantized, while a 70B model usually requires 40-80GB or more depending on precision and context window.
Production teams should calculate both model weight memory and KV cache memory, then add 10-20% operational headroom to prevent out-of-memory failures.
Can Kubernetes run local LLMs?
Yes, Kubernetes can run local LLM infrastructure when paired with the right GPU scheduling and model-serving tools.
Common production components include NVIDIA GPU Operator, KServe, Ray Serve, Helm charts, Prometheus, Grafana, and node pools dedicated to inference workloads.
The main challenge is that LLM serving is stateful, GPU-bound, and sensitive to cold-start latency, so autoscaling policies must use queue depth, GPU utilization, and latency rather than CPU metrics alone.
How should an on-prem LLM serving architecture be designed for high availability, horizontal scaling, and predictable p95/p99 latency?
High availability requires multiple inference replicas, health checks that validate real model responses, and load balancers that understand queue depth and backend saturation.
Horizontal scaling should be based on custom metrics such as active requests, GPU cache usage, queue depth, tokens per second, and P95 latency.
Predictable tail latency also requires separating long-context requests from short interactive traffic so one batch workload does not block user-facing applications.
How do teams monitor local LLM inference in production?
Teams should monitor GPU utilization, VRAM usage, tokens per second, time to first token, P95 and P99 latency, queue depth, error rates, cache hit ratio, and per-client token consumption.
Prometheus can scrape vLLM and NVIDIA DCGM exporter metrics, Grafana can visualize service health, and OpenTelemetry can trace requests across gateways, retrieval layers, model servers, and downstream applications.
This monitoring pattern connects directly with a broader AI Token Observability Dashboard strategy.
Is self-hosting cheaper than OpenAI or other cloud APIs?
Self-hosting is not always cheaper.
It usually makes economic sense when inference volume is high, workloads are predictable, security requirements are strict, or cloud API costs are already material.
For low-volume applications, cloud APIs often remain cheaper because they avoid GPU purchases, staffing, maintenance, power, cooling, and operational complexity.
Which quantization method is best for open-source model optimization?
There is no universal best quantization method.
AWQ, GPTQ, GGUF, FP8 KV cache, and INT8 approaches each make different tradeoffs between accuracy, memory savings, runtime compatibility, and throughput.
Enterprise teams should benchmark quantized models against real evaluation sets before approving them for regulated production workloads.
What security controls are recommended for self-hosted LLM enterprise deployments?
Recommended controls include TLS or mTLS, OAuth or OIDC authentication, API gateway enforcement, RBAC, network segmentation, secrets management, signed model artifacts, audit logging, rate limits, and vulnerability scanning for model-serving containers.
For sensitive environments, teams should also evaluate air-gapped deployment, local registries, local package mirrors, encrypted model storage, and strict egress controls.
When should an enterprise avoid local LLM deployment infrastructure?
An enterprise should avoid local deployment when usage volume is low, model requirements change frequently, GPU operations expertise is limited, or the business does not have strict privacy and compliance requirements.
In those cases, a hybrid or cloud-first architecture can reduce operational risk while the team validates workloads, collects benchmarks, and builds platform maturity.